
Table of Contents
Ingesting and Processing Meteorological Datasets
To capture the impact of weather on match outcomes, AI models do not rely on simple, qualitative descriptions like "rainy" or "windy." Instead, they ingest raw, quantitative data from hyper-local weather APIs (such as the Copernicus European Centre for Medium-Range Weather Forecasts [ECMWF] or NOAA's High-Resolution Rapid Refresh [HRRR]) in real time.
These APIs provide spatial-temporal coordinates mapping parameters like precipitation rate (measured in mm/hr), wind vectors (meters/second, resolved into u and v directional components), relative humidity (%), ambient temperature (°C), and barometric pressure (hPa). The spatial resolution of these grids can be as fine as 1 to 3 kilometers, allowing predictive algorithms to simulate conditions directly over stadium coordinates at kickoff time and model hourly deviations across the 90 minutes of play.
Aerodynamic and Biophysical Ball Dynamics
Weather directly alters the physical laws governing the sport. For instance, air density (ρ) is a function of temperature, barometric pressure, and relative humidity. According to the ideal gas law, colder, high-pressure air is significantly denser than warm, humid air.
This density shift changes the drag coefficient (Cd) and the Magnus effect on a flying football. In high-density environments, long passes, crosses, and direct free kicks experience greater aerodynamic drag and curve more sharply. This alters cross accuracy, long-ball accuracy, and goalkeeper reaction windows.
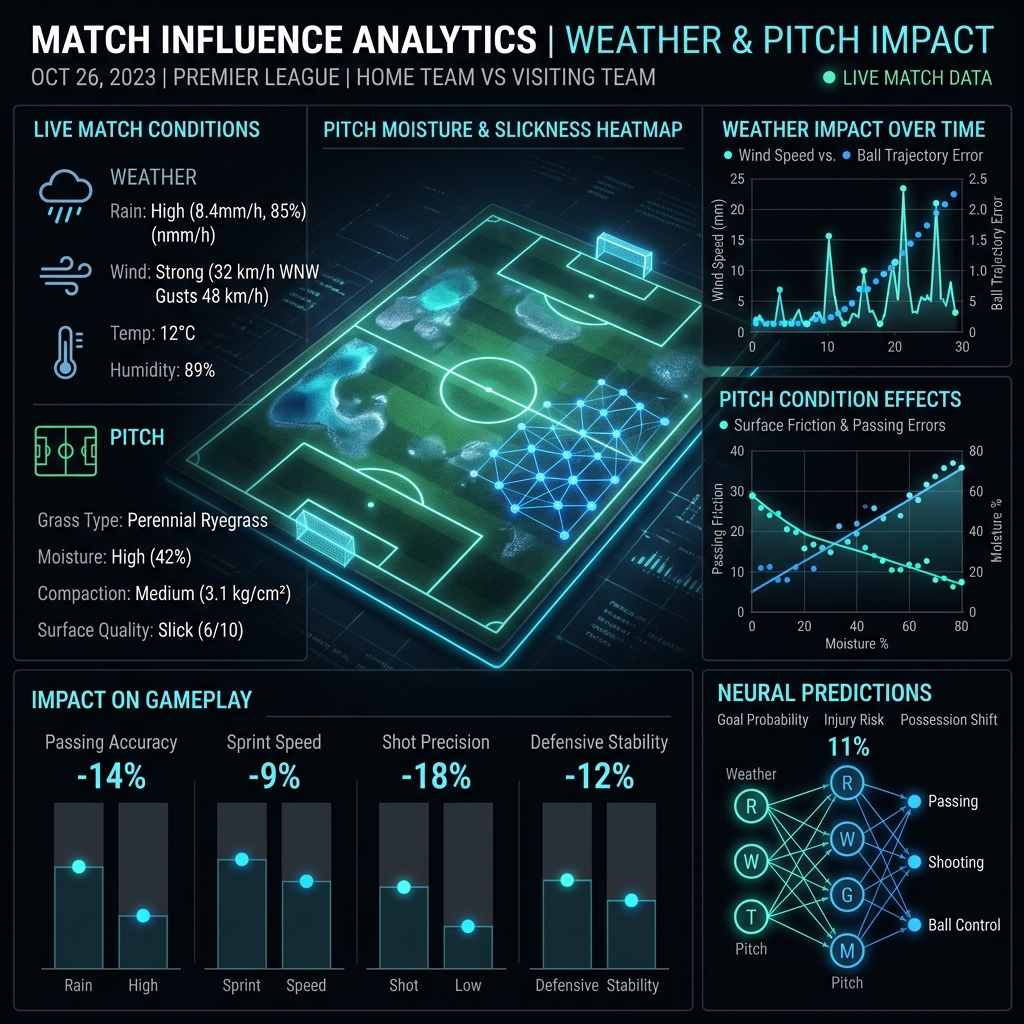
Furthermore, wind vectors alter the trajectories of high-arcing balls. A headwind exceeding 15 km/h degrades long-ball passing efficiency by up to 14% based on empirical tracking data, forcing teams to adapt to short, low-ground passes.
Additionally, player biometrics change with humidity and temperature. High wet-bulb temperatures accelerate player fatigue, leading to a statistically significant drop in late-game high-intensity runs. This directly correlates with lowered goal frequencies in the final 15 minutes of play, an essential factor when modeling in-play goals or late-stage Under/Over lines.
Pitch Topology, Moisture, and Friction
The interaction between the ball and the pitch surface determines the speed and flow of play. Pitch topology is defined by grass height (typically 22-28mm in professional leagues), turf composition (natural rye-bluegrass, hybrid systems like Desso GrassMaster, or synthetic turf), and soil moisture tension.
Watering schedules—specifically pre-match and halftime irrigation—are systematically tracked by models. A wet pitch reduces the coefficient of sliding friction (μk), which accelerates ball slide speed while dampening the bounce height (reducing the coefficient of restitution, e).
In contrast, a dry pitch or synthetic turf increases traction, resulting in higher deceleration of the ball and greater joint torque for players. Models ingest these values to predict passing speed and defensive tackle success rates. On low-friction, wet pitches, sliding tackles carry over longer distances, leading to a 12% increase in mistimed challenges and a subsequent rise in yellow and red cards.
Feature Engineering for Machine Learning Models
Before raw weather metrics enter a neural network or gradient boosted tree (like XGBoost or LightGBM), they must undergo feature engineering. Rather than feeding raw wind speed, models compute the "Wind-Match Alignment Angle" (WMAA), which calculates the dot product of the wind vector against the pitch orientation. This determines if the wind is a crosswind, headwind, or tailwind for either attacking direction.
Similarly, precipitation is modeled using a decay function. Rain that falls three hours prior to kickoff has a different effect on soil saturation than rain during the match. A "Pitch Water Accumulation Index" (PWAI) is calculated as:
PWAIt = Σ (Pt-i * e-λ * i)
where P is precipitation at hour t-i, and λ is the drainage decay constant specific to the stadium's drainage infrastructure. This index represents the real-time surface speed, which directly maps to passing completion rate deviations.
Exploiting Bookmaker Inefficiencies for +EV
Bookmakers are notoriously slow to adjust lines for weather fluctuations, especially in secondary markets like Total Corners, Total Cards, and Under/Over 2.5 Goals. Bookmaker models generally rely on historical averages of the competing teams, applying only minor adjustments for heavy rain.
AI models exploit this lag by identifying fixtures where the combination of high PWAI (wet pitch) and strong headwinds will force both teams to abandon wide attacking structures and play narrow, low-ground styles. This tactical shift reduces cross volume, leading to a predictable drop in total corners.
For instance, when an AI model projects 8.2 expected corners for a match where the bookmaker has set the line at 10.5, it represents a highly profitable +EV opportunity. By capturing Closing Line Value (CLV) before the market moves, data-driven bettors consistently gain a mathematical edge.
Stop Guessing, Start Investing
Access the same machine learning models the professionals use. See today's highest +EV predictions across global leagues.
View Today's AI Picks →